Analyze Your Trading Performance
See what your trading results are really telling you.
Upload your live MT4 or MT5 trading account and get a clean, professional breakdown of your performance, risk, consistency, and edge, across every trade, session, and market condition.
Built for traders who want answers to refine their results and make better trading decisions.


Powerful Trading Platforms, Copy Trading & Free MetaTrader Scripts
Trade with confidence on an EA-friendly trading platform and automate your trading strategies. Enjoy the choice of the best trading platforms, including MT4, MT5, and ACY Trading Platform, via webtrader & mobile apps for iPhone and Android devices. Plus, you get 12 free MetaTrader scripts and a free VPS for faster execution and stability.

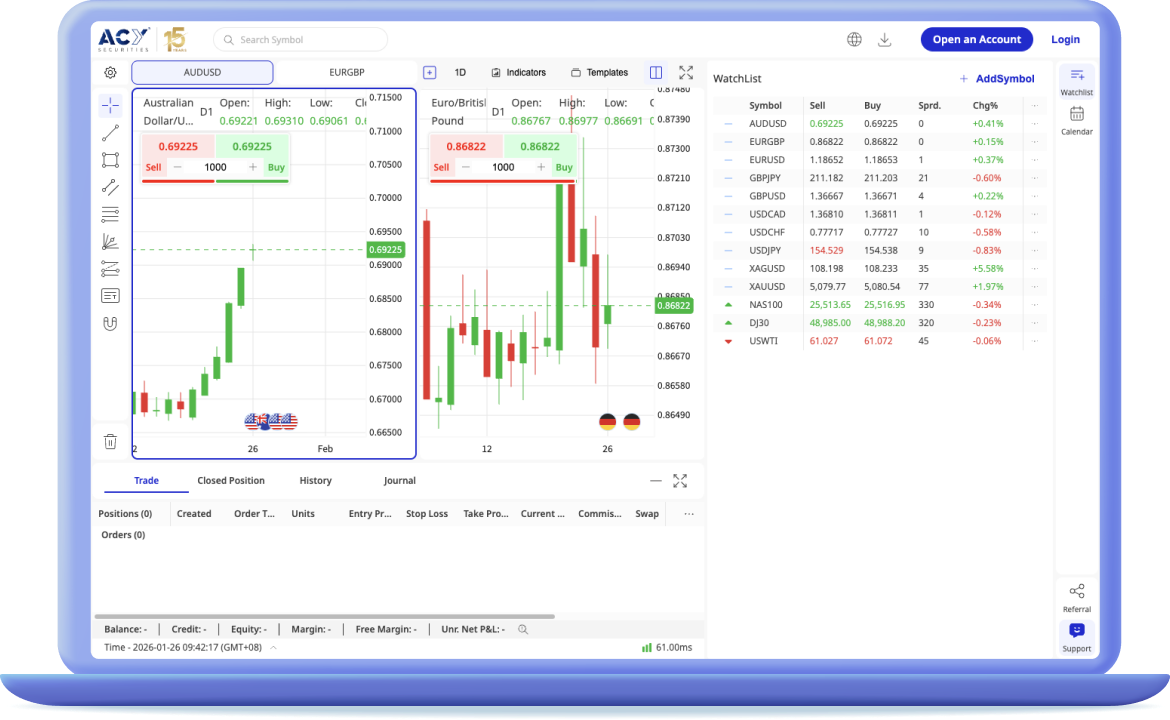
ACY Trading Platform
The trading platform is our innovative trading platform built from the ground up. It offers a seamless, web-based trading experience across all devices. Perfect for beginners and seasoned traders, it features a built-in economic calendar, multi-symbol charts and dynamic margin with guaranteed stop loss orders.

MetaTrader 4
Fast, reliable & EA friendly.Get instant access to one of the world's most popular trading platforms, MetaTrader 4 (MT4). MT4 offers traders a wide range of features including advanced charting, automated trading and a fully customisable dynamic dashboard.

Trading Performance
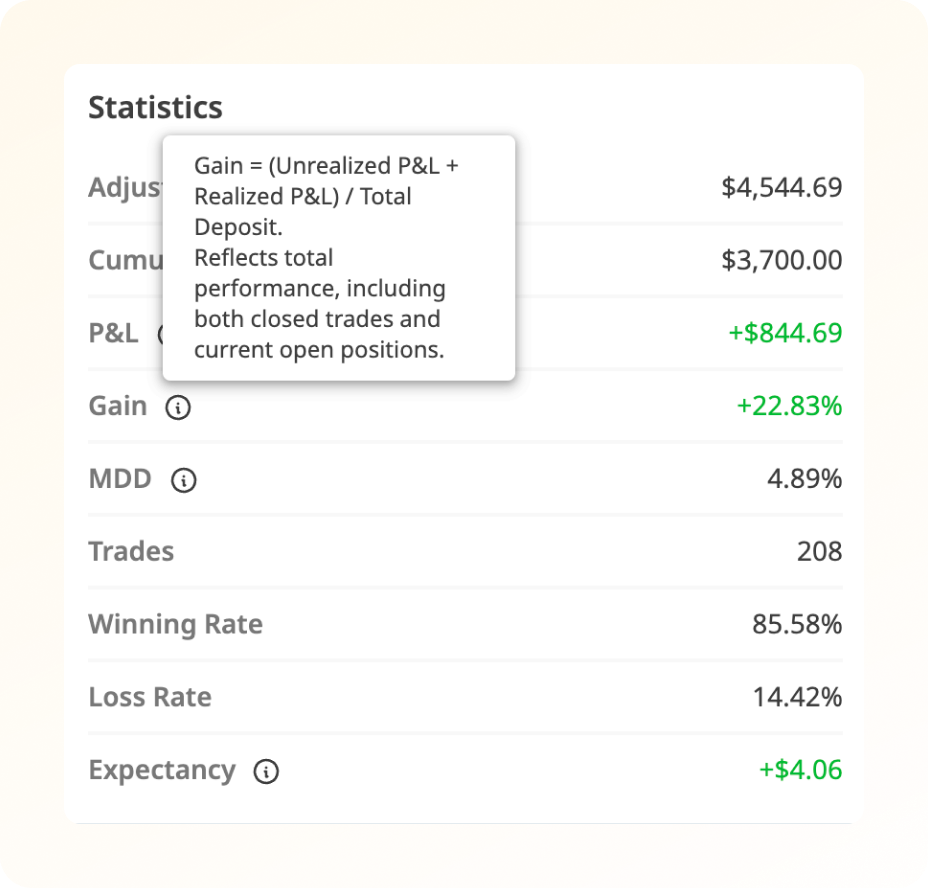
Get a comprehensive view of your trading results with our intuitive performance dashboard. Track your progress over time and make data-driven decisions with real-time statistics.
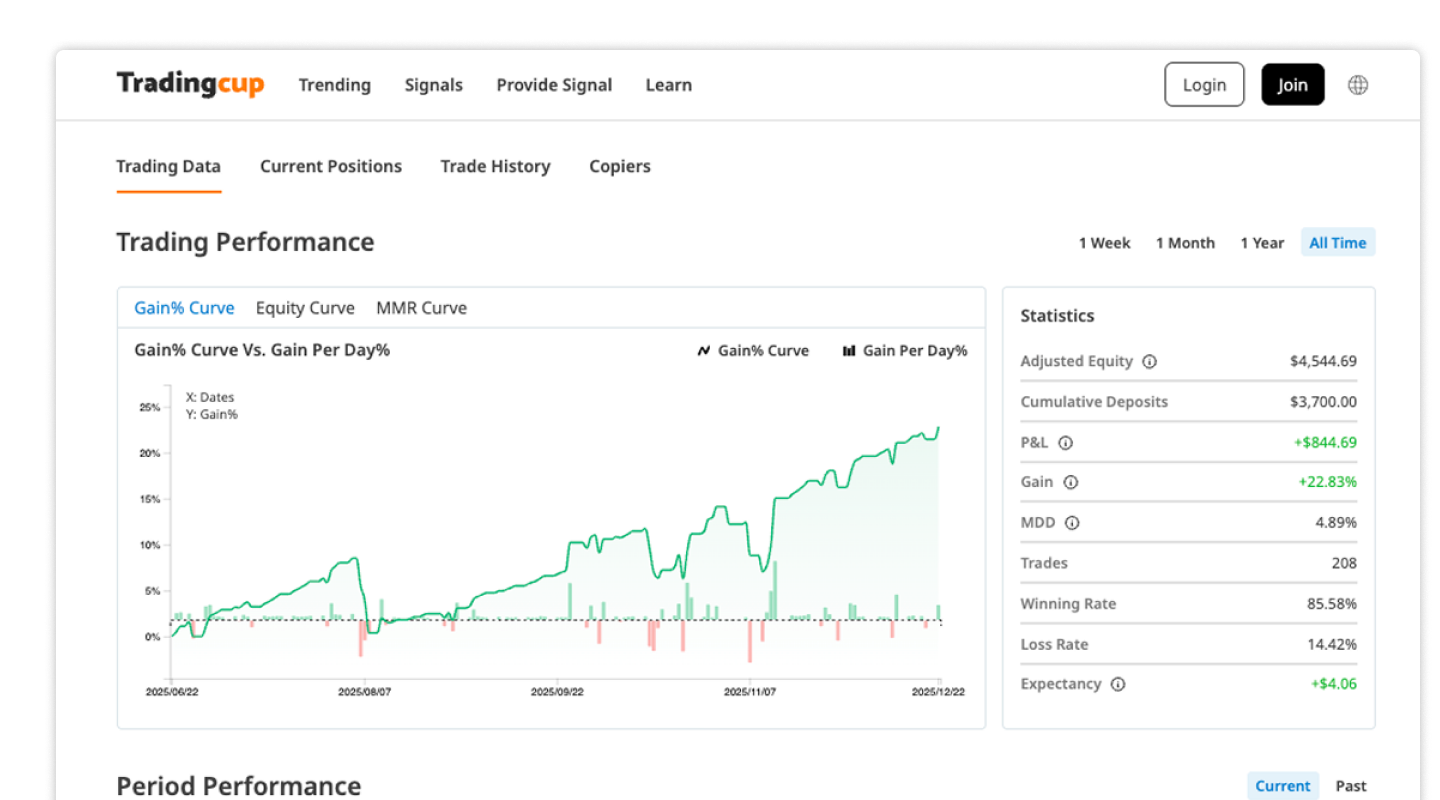
- Gain% Curve — Visualise your cumulative percentage gains over time
- Equity Curve — Track your account balance progression
- MMR Curve — Monitor your margin maintenance requirement trends
Flexible time ranges filter your performance data by 1 Week, 1 Month, 1 Year, or All Time to analyze short-term patterns or long-term growth.
Period Performance
Break down your trading results by timeframe to identify trends, evaluate consistency, and understand how your strategy performs across different periods.
View Options
Toggle between Current and Past to compare your active performance against historical results from previous periods.
Why It Matters
- Today / This Week — Monitor short-term execution and recent momentum
- This Month — Assess ongoing strategy effectiveness and consistency
- This Year — Evaluate overall annual performance and growth trajectory
Compare winning rates across periods to spot whether your edge remains consistent or varies with market conditions. Use the Current vs. Past toggle to benchmark your progress against previous weeks, months, or years.
Trading Analytics
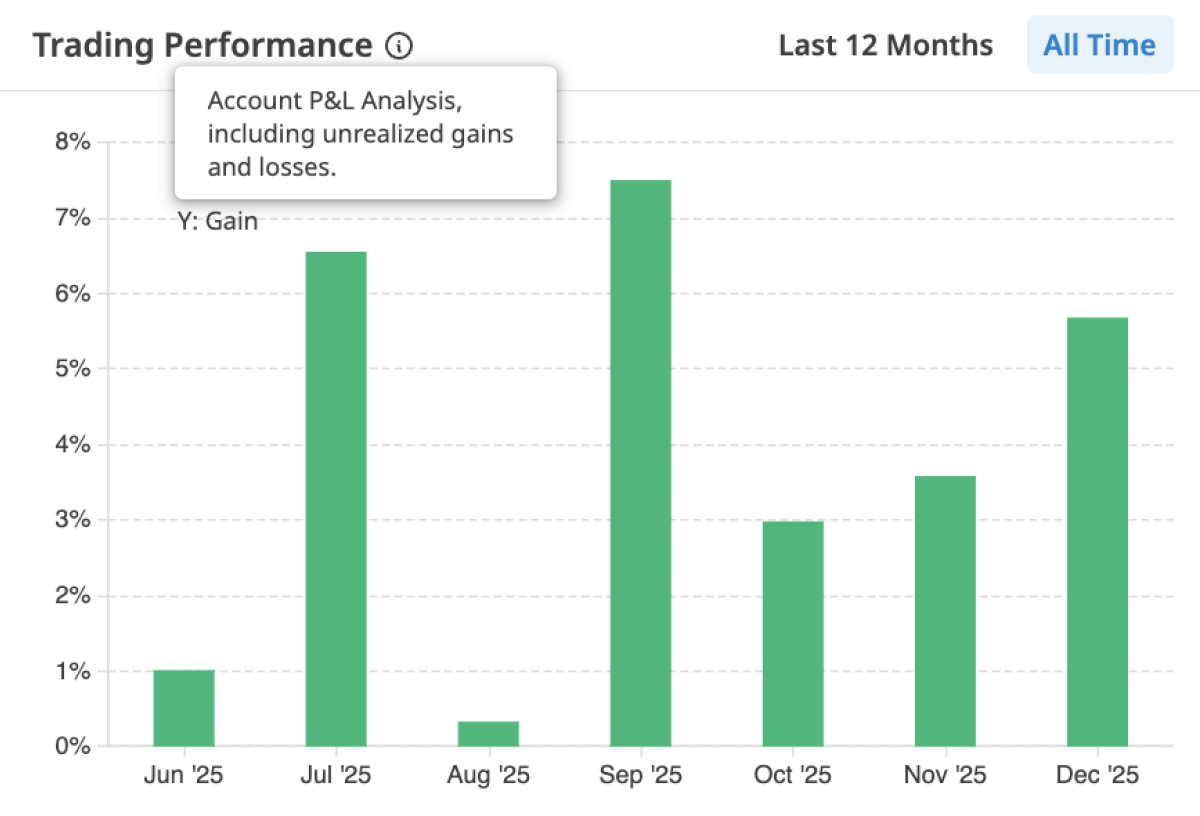
Monthly Performance
Trading Performance Chart Track your percentage gains month by month. Identify your strongest performing periods and recognize seasonal patterns in your trading results.
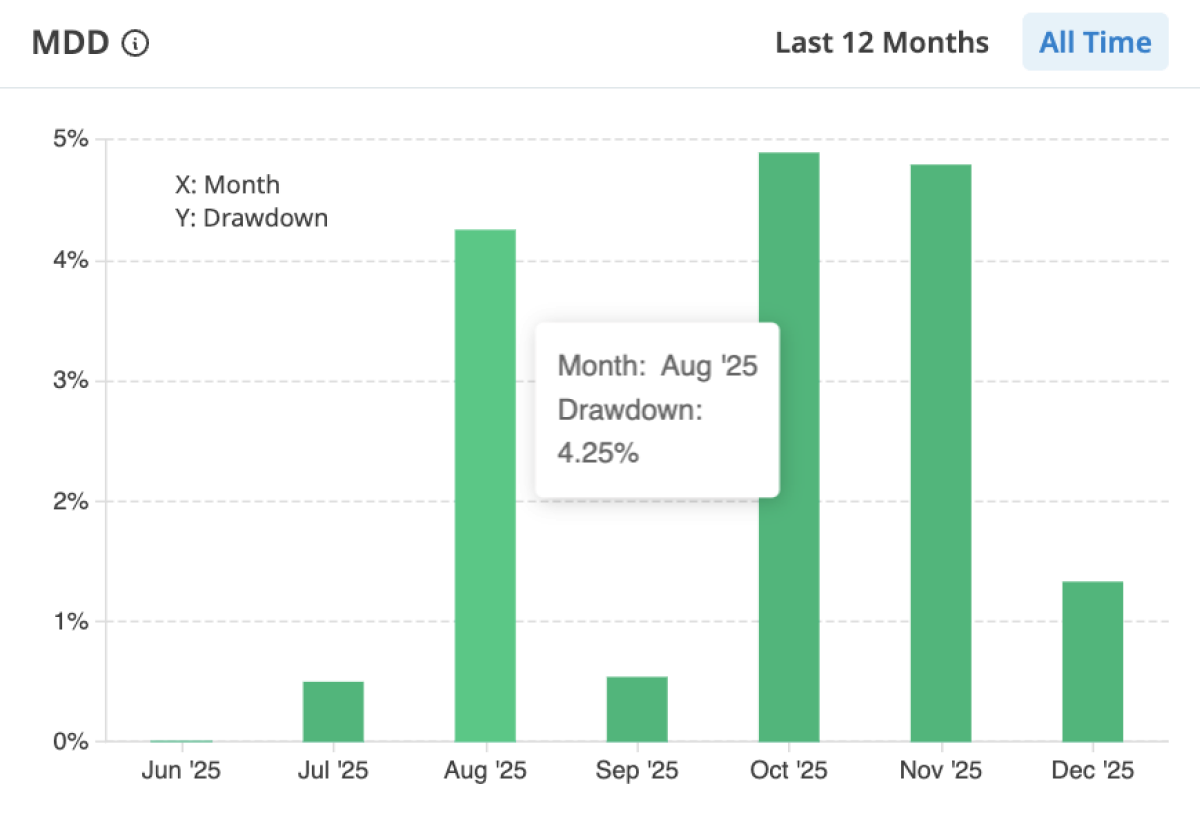
Risk Analysis
MDD (Maximum Drawdown) Monitor your monthly drawdown levels to assess risk management effectiveness. Lower, consistent drawdown values indicate disciplined position sizing and stop-loss adherence.
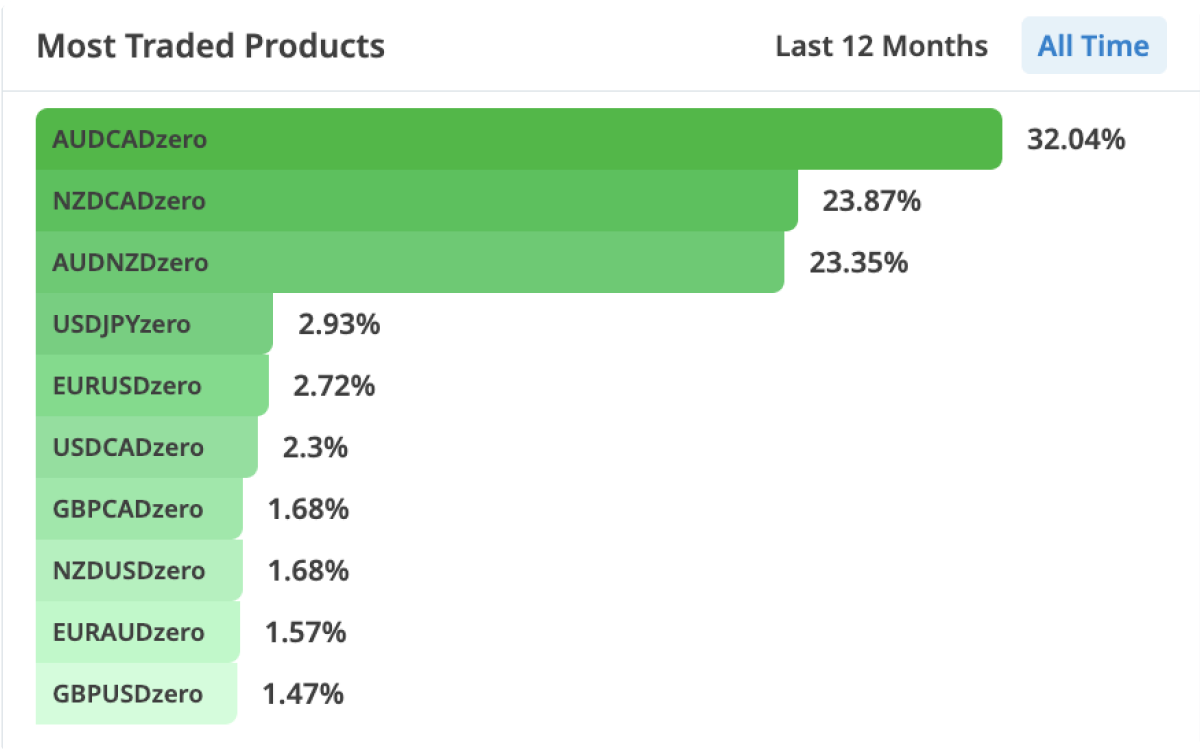
Instrument Insights
Most Traded Products See which instruments dominate your portfolio by trading volume. Identify whether you're diversified or focused on specific markets.
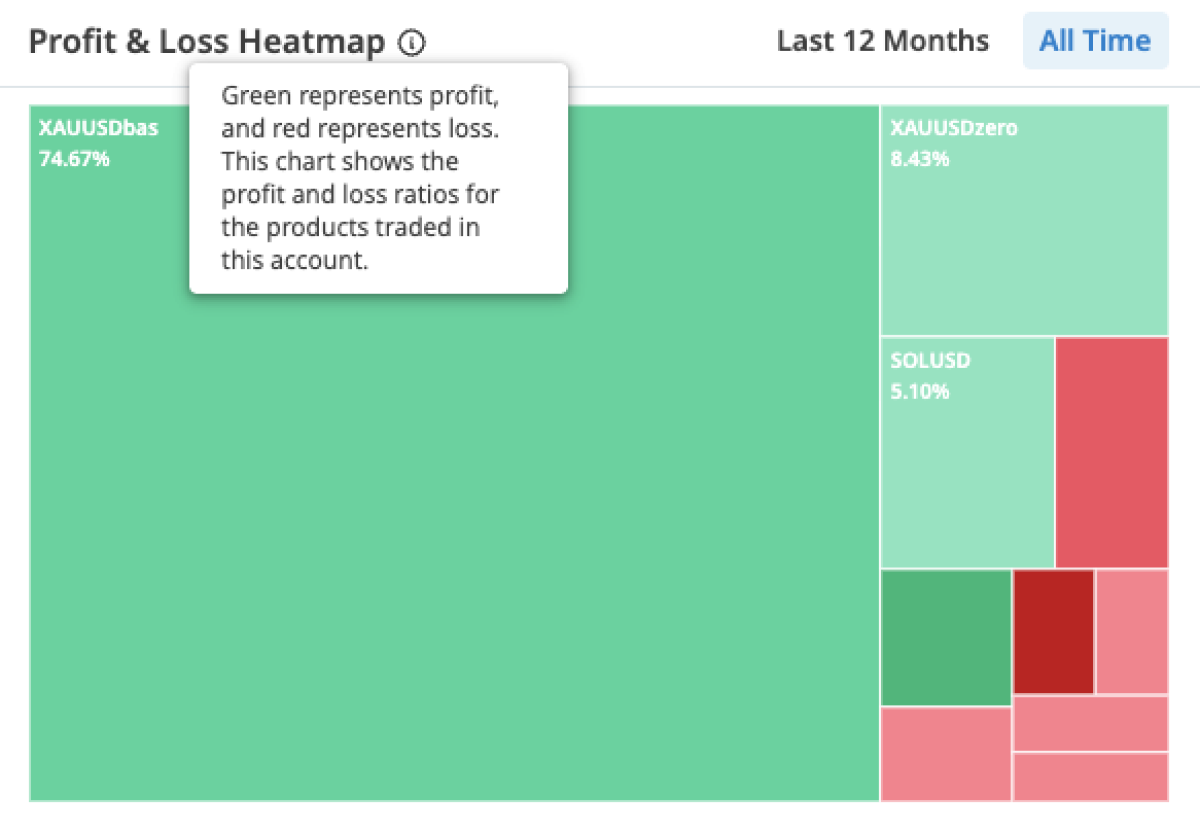
Trading Performance by Market
Profit & Loss Heatmap Visualize profitability by instrument with color-coded tiles. Quickly spot which products contribute most to your returns and which may need strategy adjustments.
Improve One Metric That Changes Everything
Based on a comprehensive analysis of over 30 million completed trades across the 15 most actively traded FX pairs, conducted by a major global retail FX broker back in 2015, retail traders were profitable on over 50% of their trades.
Yet the majority of traders still lost money.
Why?
Because the average losing trade was significantly larger than the average winning trade.
On some pairs, the average loss was nearly double the size of the average win.
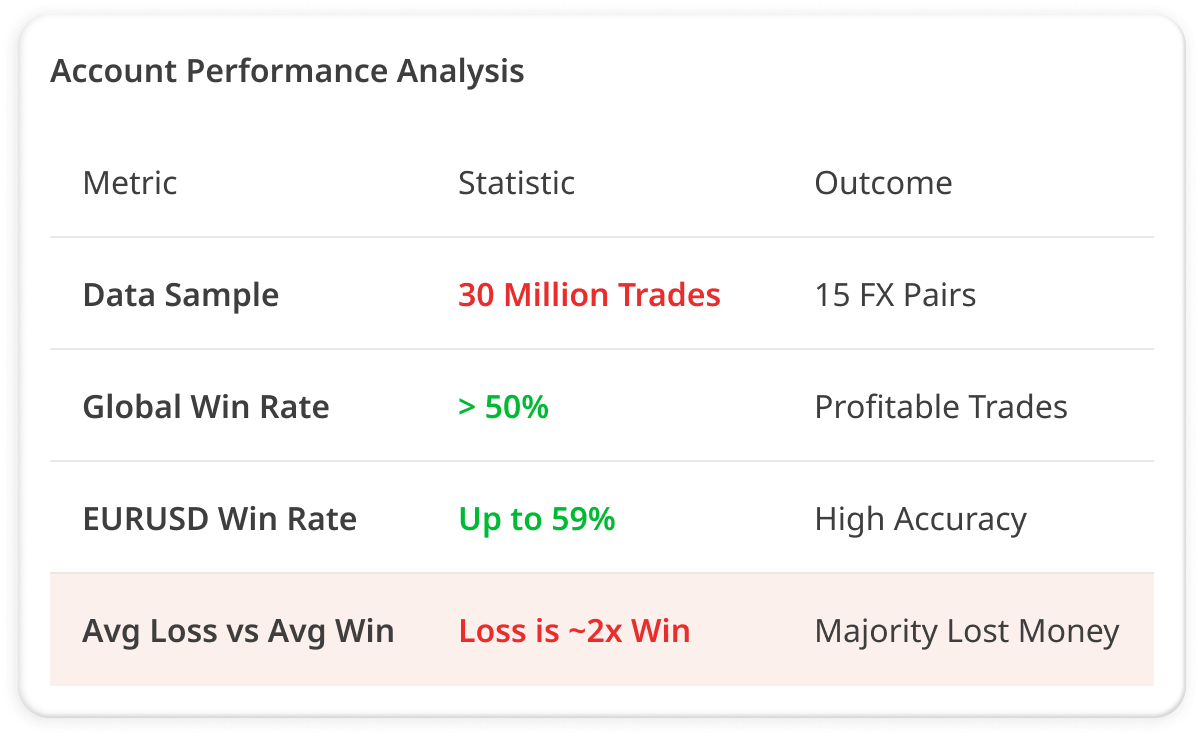
On EURUSD, the win rate climbed as high as 59%.
This is why one of the most time-tested principles in trading still holds true:
Cut your losses short and let your profits run.
You do not need to change everything to improve your results. Often, improving one metric is enough.
You do not need to change everything to improve your results. Often, improving one metric is enough.
A Live Example: When a High Win Rate Still Loses Money
Below is an example from a real trading account.
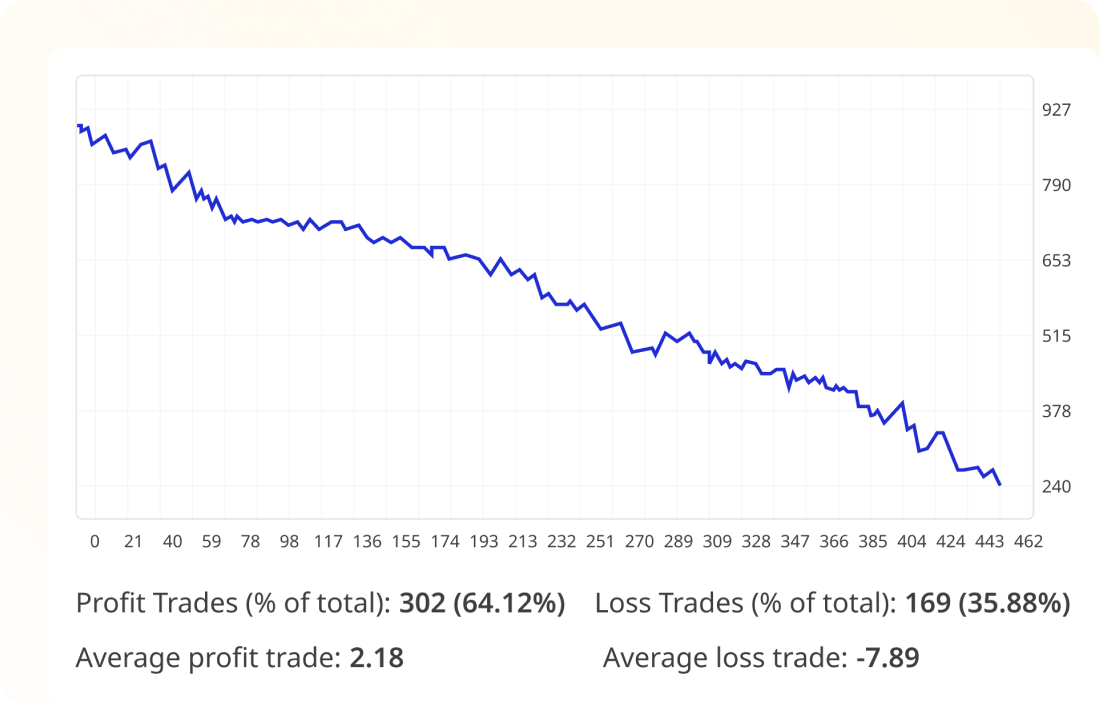
At first glance, the win rate looks strong.
- 64% of all trades were winners
- Only 36% of trades were losses
On the surface, many traders would assume this system should be profitable.
But the equity curve tells a very different story.
The key issue is not how often the trader wins.
It is how much they win versus how much they lose.
This means the average loss is more than three times larger than the average win.
Even with a high win rate, this cannot work mathematically over time.
When losses are allowed to grow while profits are cut short, the account slowly bleeds lower, exactly as shown by the steady downward equity curve above.
This is why win rate alone is a misleading metric.
One Change Can Reshape Your Entire Trading Curve